VCS Technology is the most powerful tool available for blood cell analysis. An acronym for Volume, Conductivity and Scatter, this proprietary technology offers the greatest sensitivity, specificity and efficiency of any cell analysis system available today.
The analysis begins with a properly prepared sample. Using a combination of proprietary reagents and physical agitation in an orbital mixing chamber, RBC抯 are gently lysed while WBC抯 are maintained in their 搉ear native state?
The VCS Analytical Module in the Coulter?STKS, MAXM and MAXM A/L is a LASER based Flow Cytometer that has been modified to provide more information on unstained cells than is possible using light scatter alone
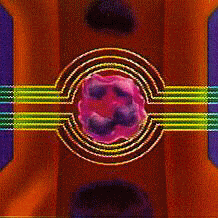 VOLUME:
As opposed to using 0?light loss to estimate cell size, VCS utilizes the Coulter Principle of (DC) Impedance to physically measure the volume that the entire cell displaces in an isotonic diluent. This method accurately sizes all cell types regardless of their orientation in the light path.
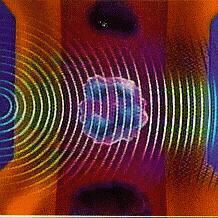 CONDUCTIVITY:
Alternating current in the radio frequency (RF) range short circuits the bipolar lipid layer of a cell抯 membrane, allowing the energy to penetrate the cell. This powerful probe is used to collect information about the internal structure of the cell, including chemical composition and nuclear volume.
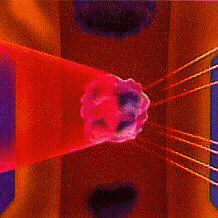 SCATTER:
When a cell is struck by the coherent light of a LASER beam, the scattered light spreads out in all directions. Using a proprietary new detector, median angle light scatter signals are collected to obtain information about cellular granularity, nuclear lobularity and cell surface structure.
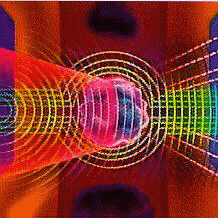 SIMULTANEOUS MEASUREMENTS:
VCS is the only single channel analysis that uses 3 independent energy sources to probe approximately 8,192 cells in their near native state. Working in concert with each other, these three measurements are taken simultaneously,each
providing 256 channels of resolution ?over 16,700,000 channels in all. VOLUMETRIC COMPENSATION:
In most optical and electrical measurements, the volume of the cell influences the signal that is generated. For example, a small cell that is a poor conductor can give a signal that is similar to that which comes from a large cell that is a good conductor simply due to the fact that the energy has to travel farther in the large cell. Similarly, every angle of light scatter from 0?through 90?is influenced by cellular size. The low angles are the most affected, and indeed are often used as an indirect estimation of cellular size.
Because VCS Technology includes a highly accurate measure of cell volume, we can use this information to correct the Conductivity and Scatter signals. The result of this volumetric compensation is a pair of measurements that are very powerful, and unique to Coulter.
OPACITY:
By correcting the Conductivity signal so that it is no longer influenced by cell size, we obtain a measurement that is related only to the internal structure of the cell. This allows VCS Technology to separate cells of similar size, but different internal composition. It also allows the instrument to calculate the Nuclear/Cytoplasmic ratio - a feature useful in distinguishing variant Lymphocytes from normal Lymphs.
ROTATED LIGHT SCATTER (RLS):
Using a method similar to that used in Opacity, Coulter eliminates the size component of the light scatter signals. In so doing, we were able to determine the optimum angle of scatter for each cell type and design a scatter detector that covered this range (10?to 70?. This allows VCS Technology to accurately separate what would normally be mixed cell types (such as Neutrophils and Eosinophils) into distinct clusters without mathematical manipulation. It also enhances the separation between the non granular cell types.
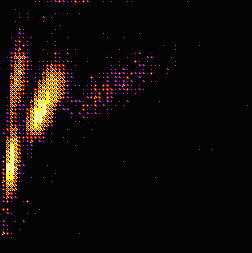 Without volume compensation.
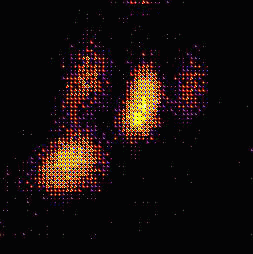 With volume compensation.
THREE DIMENSIONAL ANALYSIS:
As each of the over 8,000 WBC抯 or 32,000 RBC抯 are analyzed by VCS Technology - Volume, Conductivity, Scatter, Opacity and RLS measurements are taken. Each cell is then assigned an X, Y and Z coordinate in a 3-Dimensional array based respectively on it抯 RLS, Volume and Opacity.
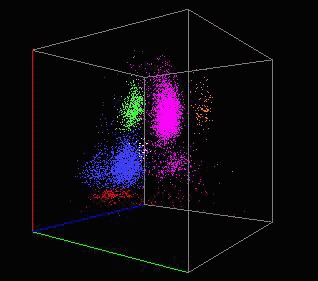 DISTINCT CLUSTERS:
Cells with similar characteristics form distinct clusters in this array of over 16,700,000 data points.
Sophisticated software analyzes these clusters for quantity (reported as a percentage for each cell type), position (an indicator of morphology), and density (useful in the detection of sub-populations within the main cell classification).
SUPERIOR FLAGGING:
Deviation of these clusters from their normal quantity, shape, position or density are an indication of a distributional or morphological abnormality. A comprehensive set of flags is used to point the medical technologist toward the most likely cause of these abnormalities. Additional sets of user definable flags allow the laboratory to customize their systems to achieve optimal efficiency.
[此贴子已经被作者于2005-3-24 23:06:00编辑过]
|